marco@blog.luyckx.dev:~$ cat compared-to-what.md
Compared to what
$ git log --follow compared-to-what.md 1 edition
First published.

Said across a table about a pain score, a severity rating or a colleague’s claim to have succeeded, it closes the meeting. Nobody pushes back, because it is true. Almost everything is relative, and the almost does a lot of work.
What the line gets used to prove is something else: that because the judgment is relative, the thing cannot be measured. Subjective, therefore unmeasurable. That inference is the one worth checking, and the place to check it is the most ordinary measurement of human experience there is.
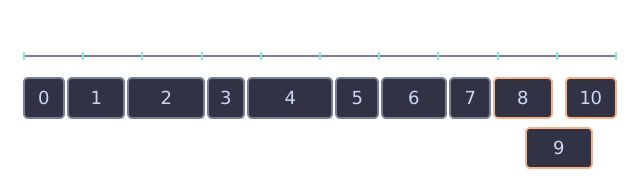
A nurse asks for a number from 0 to 10.
In 1946 S. S. Stevens published four pages in Science that sorted every scale into four kinds. A nominal scale only names things. An ordinal scale puts them in order, an interval scale has equal steps between the marks, and a ratio scale is what a tape measure is.
Each kind permits its own arithmetic. An ordinal scale gives a median, the middle item with as many above it as below. It does not give a mean, because a mean adds the steps together, and on an ordinal scale nobody has said the steps are equal.
Stevens was blunt about what that permits.
In the strictest propriety the ordinary statistics involving means and standard deviations ought not to be used with these scales, for these statistics imply a knowledge of something more than the relative rank-order of data.
He was not a purist about it. On the same page he granted what he called a “pragmatic sanction” for the illegal arithmetic, because in numerous instances it leads to fruitful results, and then said what the price is: such means are “in error to the extent that the successive intervals on the scale are unequal in size.”
The prohibition and the concession sit together, and anyone quoting one without the other is quoting a different man.
The 0-to-10 pain score is an ordinal scale in interval clothing. In 2024 four researchers went through 346,892 patient reports from QUIPS, an international quality registry for pain after surgery, and checked whether the ten steps were the same size. They were not: the categories were ordered, they had different widths, and at the top end they overlapped.
A 6 is more than a 3. It is not twice a 3, and nobody knows what fraction of a 9 it is.
So far the aphorism is winning. The score is relative to the patient’s own baseline, and the arithmetic every ward runs on it has no licence.
I have done the same thing with a severity rating and been paid for it. A client once asked me to lower a finding from high to medium on the grounds that the previous tester had found something worse and called that one medium, so mine could hardly rank above it. The order was right; the label came from a baseline nobody had written down.
That is what “everything is relative” looks like in a spreadsheet. It is also the moment to look at what happens when somebody takes the objection seriously and designs around it.
Between October 2009 and May 2011 the Global Burden of Disease study ran the largest attempt anyone has made to weigh suffering. Its job was to attach a disability weight, a number between 0 and 1, to each of 220 health states, from mild hearing loss to acute schizophrenia, so that the states could sit on one scale.
The obvious method is to ask people how bad each state is. Give them a 0-to-10 scale, or a 0-to-1 slider, and average.
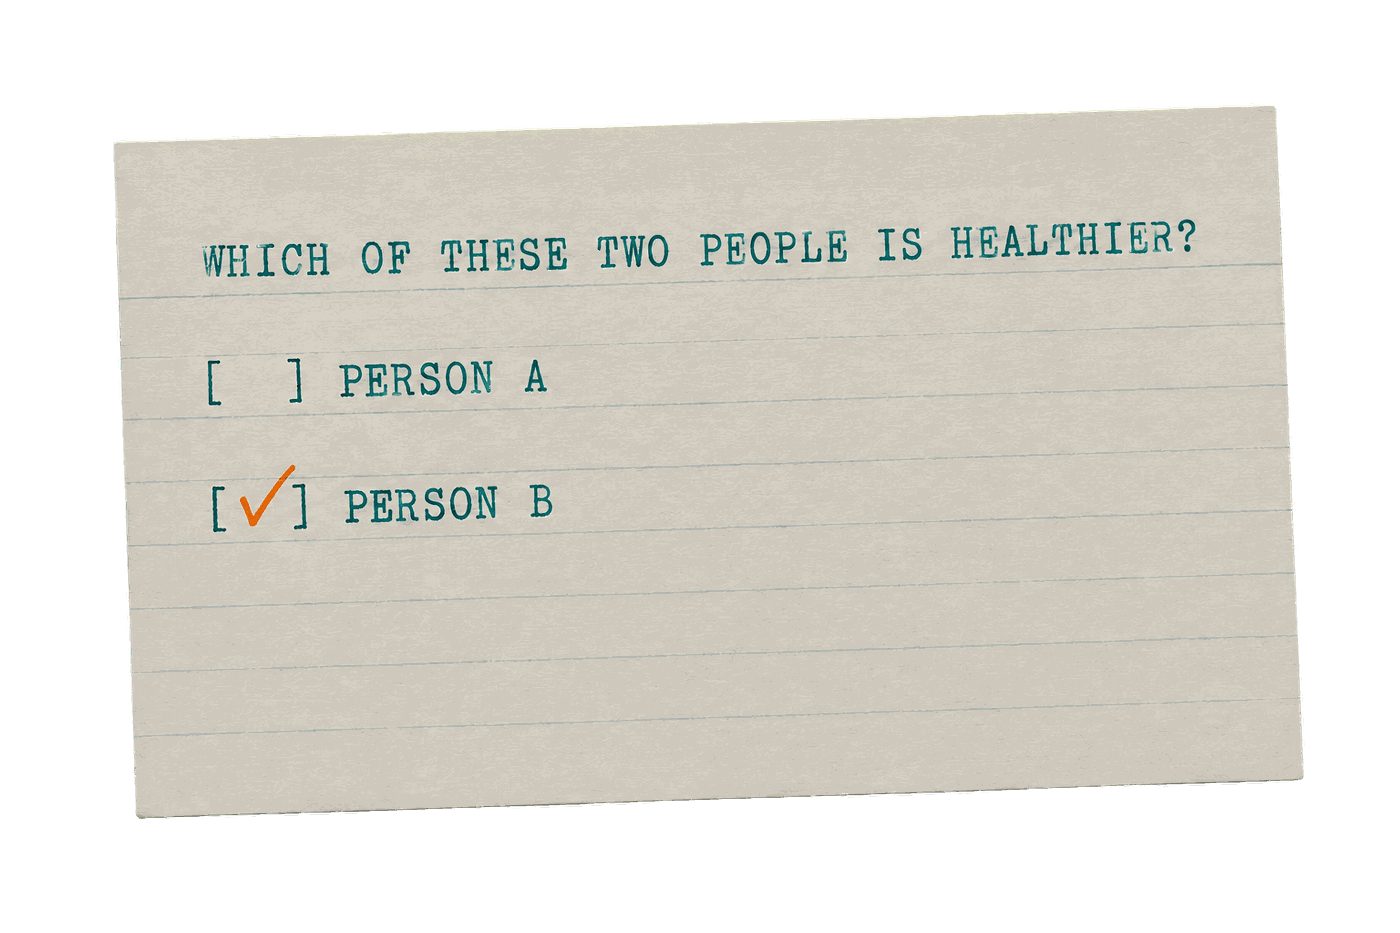
The study did not do that. It showed each respondent two short descriptions, each of a person in a particular health state, and asked one question: which of these two people is healthier? Then it did it again with another pair.
Fifteen pairs per respondent, each description 35 words or fewer. 13,902 respondents interviewed at home in Bangladesh, Indonesia, Peru and Tanzania and by telephone in the United States, plus 16,328 through a web survey. 30,230 people.
Nobody was asked how much. Everybody was asked which.
Then the authors checked whether each country’s answers agreed with the answers pooled from all of them. The correlation was 0.9 or higher in every survey but one. Bangladesh came in at 0.75, which is the honest wobble and stays in the sentence.
That is the finding worth stopping on. Thirty thousand people on four continents, most of whom would not recognise each other’s lives, were handed pairs of strangers and asked which one was worse off, and they agreed. The authors said it plainly: against the popular hypothesis that disability judgments vary widely across cultures, the results were highly consistent.
The relative judgment is the part of the measurement that works. The absolute number is the part that fails.
Test that against the second half of the method, because a ranking is not a weight. Paired comparisons put 220 states in order and say nothing about the distance between them. To get from “worse than” to a number on a 0-to-1 scale, the team needed an anchor.
The anchor came from a separate set of questions about population health equivalence. They appeared in one version of the web survey, and they covered 30 of the 220 states.
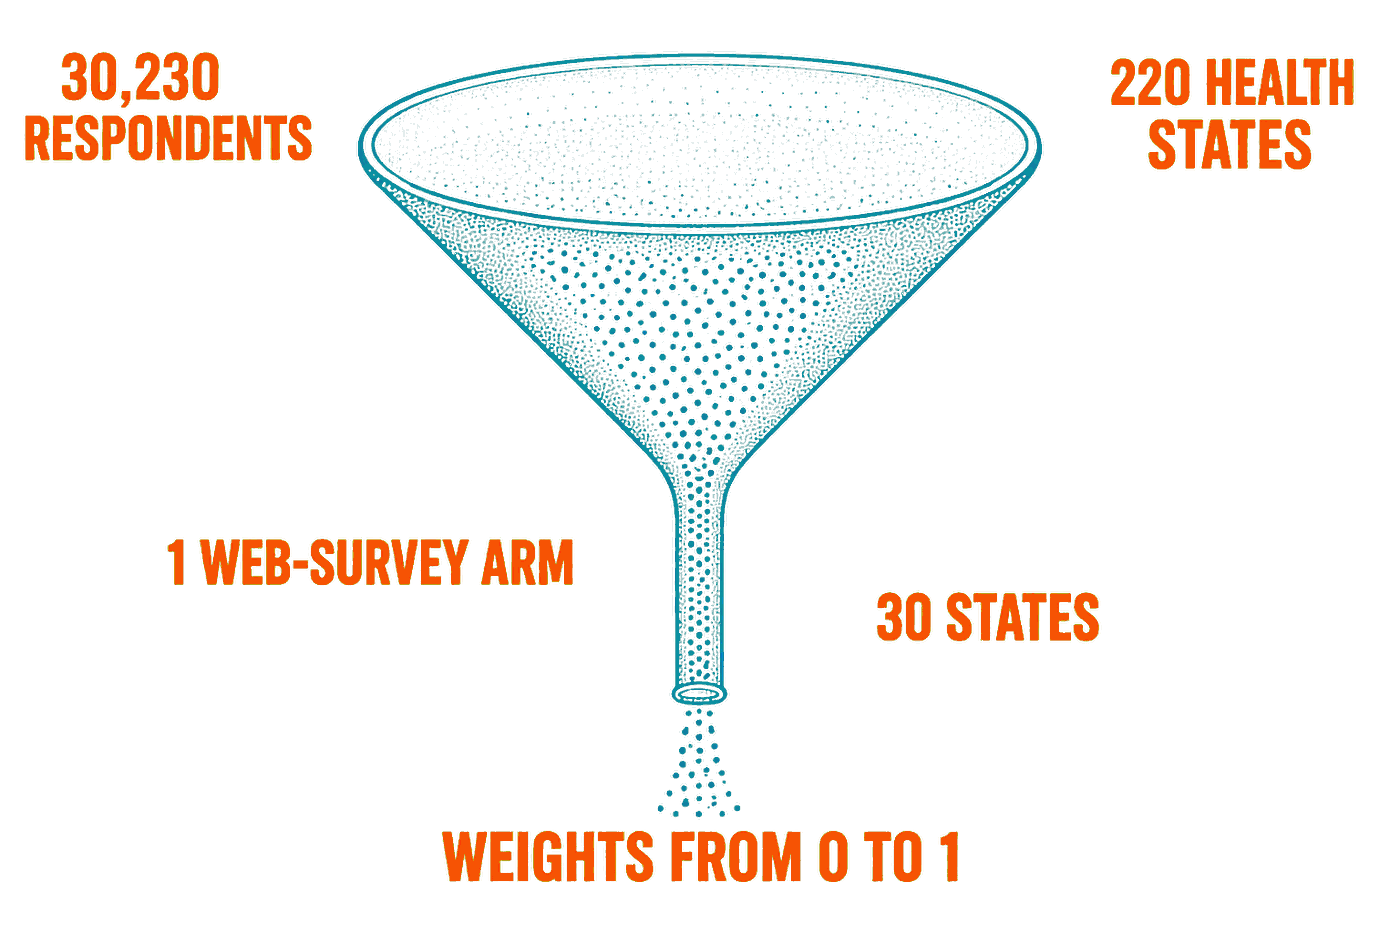
Prose makes the two stages sound alike. Two sample sizes in one sentence, and the ear moves on. The shape does not let it: the number everyone quotes rests on the neck.
The thick part of the study, five countries and 30,230 people, produced the ordinal result, the ranking, the “which”. The thin part, one arm of one survey on 30 states, produced the cardinal result, the weight, the “how much”. And the thin part is the one that gets printed as though it were objective, while the thick part is dismissed as subjective.
Comparison travels. The anchor does not.
Look at what came out of the neck.
| Health state, GBD 2010 | Disability weight |
|---|---|
| Major depressive disorder, severe episode | 0.655 |
| Distance vision blindness | 0.195 |
| Amputation of both legs, long term, without treatment | 0.494 |
| Amputation of both legs, long term, with treatment | 0.051 |
The amputation pair is the cleaner one. The legs are equally gone in both descriptions, and the weight moves almost tenfold on whether a prosthesis is in the picture, which means the number is measuring circumstance at least as much as impairment. It is not hiding that: the description said prosthesis or no prosthesis, and the respondents ranked accordingly.
The number is honest about what it is. The reader is not.
Now the resistance, because “reliable” is a word that slides into “true” if nobody holds it.
The consistency may be partly manufactured. Each health state was described in 35 words or fewer, and 35 words strip out most of what a culture would add: what the family does, what the work is, what the neighbours say. The authors conceded it themselves, writing that the short descriptions “could have exaggerated the consistency of responses across settings.”
Bangladesh at 0.75 is a real outlier, not a rounding error. And there is a published critique of the weights, in Lancet Global Health in 2015, that I have not read and will not pretend to have answered.
Then there is the other side of the table. The 30,230 respondents were judging other people’s lives from outside. In 1999 Albrecht and Devlieger interviewed 153 people with moderate to serious disabilities about their own lives, and 54.3 percent called their quality of life excellent or good, against what outside observers would have guessed for them.
They named it the disability paradox. Fifty-four percent is barely a majority, and a reply published the next year argues the paradox lives in the observers’ assumption rather than in the people observed. Either way, the people inside a state and the people ranking it from outside are not answering the same question.
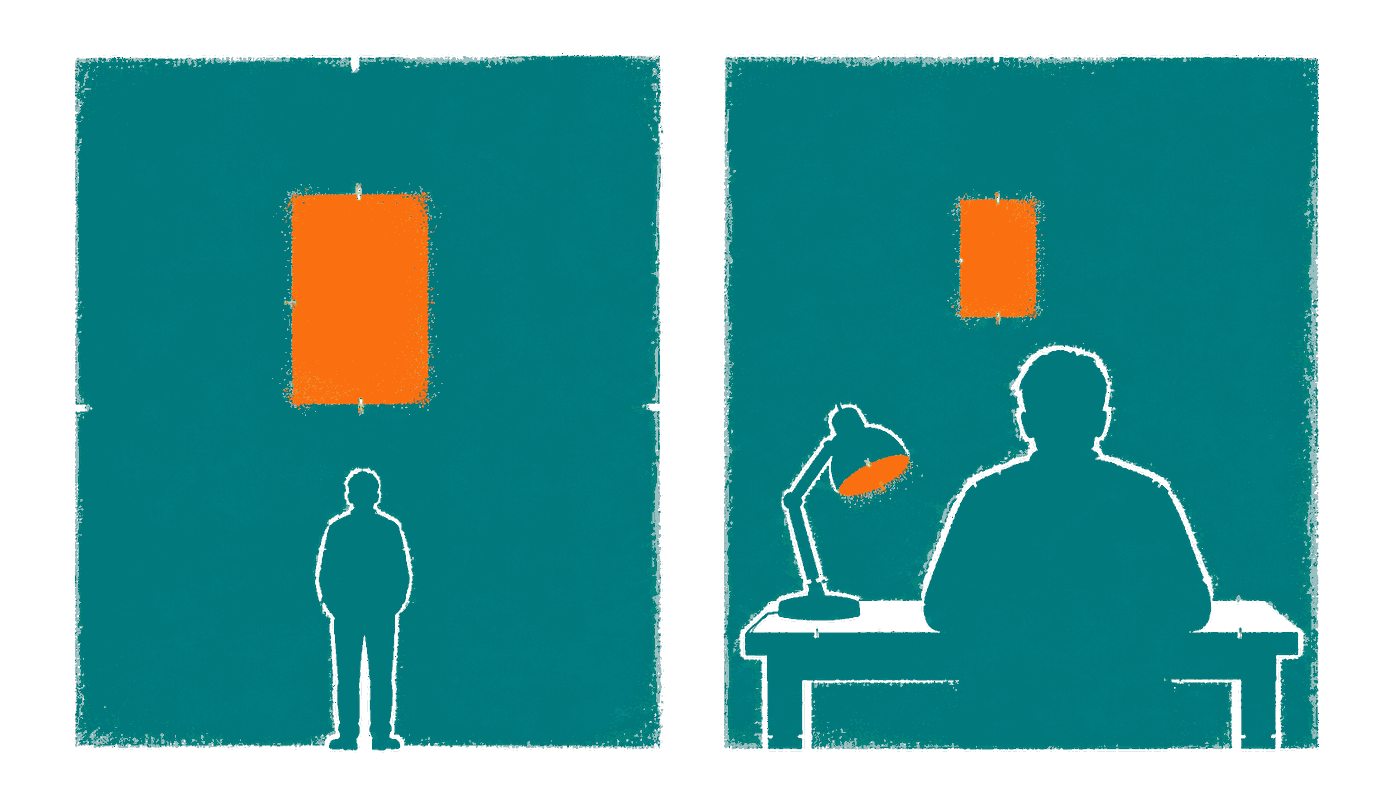
Reliable means the judges agree with each other. It does not mean they are right.
And the anchor moves when the judges change. The 1996 weights had come from health professionals; the 2010 study replaced them with the general public, and blindness came out substantially lower than the experts had put it. The authors suggested the public might see intellectual disability as less of a reduction in health than a room of highly educated professionals does.
Neither weight set has an independent test of which is correct. The two still correlate at 0.70.
Swap the judges and the number moves. The order moves less.
This is a claim with a failure condition, which the aphorism never had. If the paired comparisons had scattered across countries, the relative half would be as unstable as the absolute half and this essay would be wrong. If two independent anchoring procedures had produced the same 0-to-1 scale, the absolute half would be as stable as the relative half and it would be wrong the other way.
Neither happened. The rankings held at 0.9 and the weights rest on one arm.
Go back to the table where somebody says everything is relative and the meeting ends.
They were right, and they drew the wrong conclusion. It is extremely difficult to build an objective, quantifiable measure of human experience, and the difficulty lives in one place: the step that turns “worse than” into “this much worse”, which is done by whoever sets the anchor. The part that is supposed to be the weakness, the subjective comparison, is the part that survived a trip through five countries.
That is where the almost ends.
Relativity did not defeat the measurement.
It was the measurement.

Curiosity of the week
Quote of the week
“The same level of wealth, for example, may imply abject poverty for one person and great riches for another, depending on their current assets.”
Daniel Kahneman and Amos Tversky, Prospect Theory, 1979